Coastal Research
Coastal Research
- Impact of seismic surveys on platform-associated fishes
- Restoring and creating low-relief nursery habitat for reef fishes
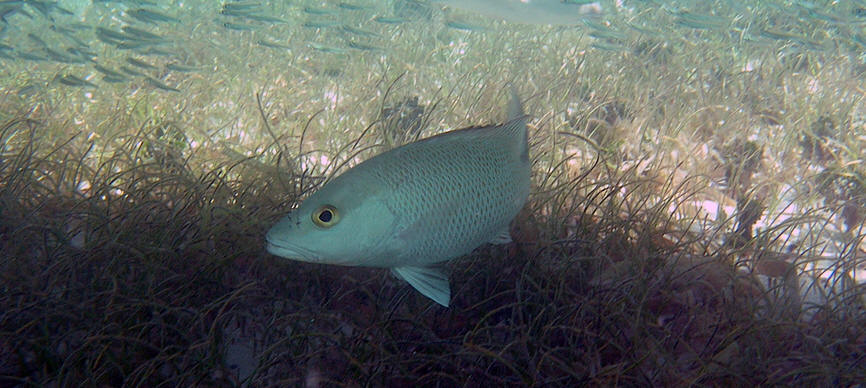
- Stable isotopes as natural markers to assess trophodynamics and habitat connectivity in tropical snappers
- Early life ecology of dolphinfishes in the northern Gulf of Mexico
- Ecology of fishes associated with Sargassum
- Early-life ecology of snapper
- Distribution of red snapper on the inner shelf in the northwestern Gulf of Mexico
- Habitat use and movement of Tarpon along the Texas coast
Impact of seismic surveys on platform-associated fishes
Our current knowledge of effects of seismic airgun surveys on fishes is inconclusive. The purpose of this study is to improve our understanding of the behavioral response of red snapper, a commercially and recreationally important fish in the Gulf of Mexico, to commercial seismic surveys. To document sound levels in the survey area, passive acoustic monitoring (SoundTrap recorders and an accelerometer) will be implemented at the study site for two months before and two months after the survey. Average sound levels, as well as received levels due to different anthropogenic sound sources will be measured. In addition, passive acoustic data will be used to document and quantify the presence of vocalizing fishes at this location. Changes in behavior (activity, spatiotemporal distribution, and site fidelity) of adult, free-swimming red snapper when exposed to airgun sounds will be studied using acoustic telemetry. Red snapper are being tagged with acoustic transmitters and then tracked for a period of four months, including two months before and after the survey, to evaluate the impact of the airgun survey on their behavior. The combination of these data will provide a comprehensive view on the impact of seismic airguns on red snapper behavior and will assist in future BOEM efforts to manage oil and gas exploration with minimized impact to fish and fisheries activity in the Gulf.
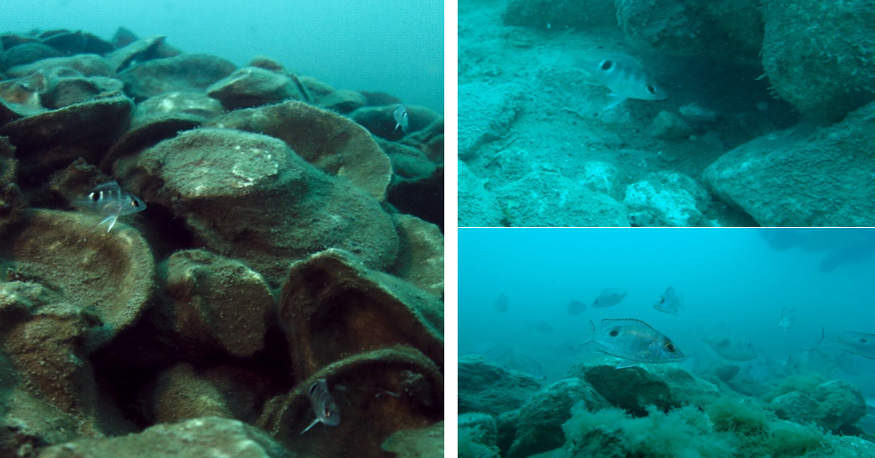
Restoring and creating low-relief nursery habitat for reef fishes
Low-relief sand shoals and shell ridges serve as refuge for a wide variety of reef-dependent fishes, including several species of high economic and/or ecological value (e.g., red snapper). Unfortunately, the availability of such habitat on the inner continental shelf of the Gulf of Mexico is very limited (< 1% of inner shelf with sand/shell/rubble habitat) and is presumed to be a potential population bottleneck for reef fishes. To date, artificial reef deployments and research have focused primarily on sub-adults and adults associated with high-relief structures, even though survival (and production) is more likely regulated by availability of suitable habitats (complex substrates) during early life (post-settlement) stages. The aim of this research is to determine the functional value of low-relief nurseries by quantifying several biological parameters including the density/composition, growth, mortality, and genetic diversity of juvenile fishes associated with this type of habitat. We are also evaluating three types of materials (bulk oyster, bulk limestone, and prefabricated composites) as low-relief nursery habitats for juvenile reef fish to improve early life survival and desired population attributes. Results demonstrate high juvenile recruitment to all three material types, and indicate that low-relief artificial reefs represent a potentially powerful management tool to expedite the recovery and ensure the sustainability of reef fish stocks, such as red snapper, in the GoM.
Funding: Texas OneGulf Partners: HARTE Research Institute TAMU-CC, UT Rio Grande Valley, Atlantis Marine Habitats, LLC, and Prestige Oyster
Associated Publications
Dance MA, Rooker JR, Kline RJ, Quigg A, Stunz GR, Wells RJD, Lara K, Lee JM, Suarez B* (2021) Importance of low-relief nursery habitat for reef fishes. Ecosphere 12: e03542. doi:10.1002/ecs2.3542
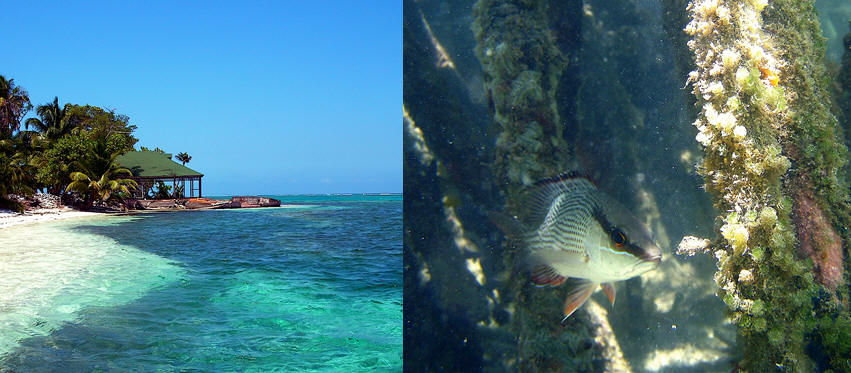
Stable isotopes as natural markers to assess trophodynamics and habitat connectivity in tropical snappers
Back-reef habitats (i.e. mangroves, seagrass beds, patch reefs) represent critical nurseries for many important fishery species in the tropics, and as coastal ecosystems are continually subjected to habitat loss, degradation, and over-fishing, identifying the most productive nearshore nurseries within these systems is becoming increasingly urgent. The aims of the current study are to (a) evaluate the effectiveness of otolith stable isotopes (δ13C, δ18O) as natural markers of nursery origin for juvenile snappers (Lutjanidae) within the Belize back-reef lagoon and (b) characterize regional, cross-shelf, and seasonal variability in primary production and food web dynamics for these juvenile snappers using stable isotopes (δ13C, δ15N) in tissues. Preliminary results indicate that isotopic signatures in otoliths may be useful in determining relative contribution rates of juvenile snappers produced at inshore and offshore nurseries within the back-reef, and dietary analyses suggest that the sources of primary productivity available to juvenile snappers inhabiting back-reef habitats may vary considerably by shelf position as well as season.
Associated Publications
Rooker JR, Dance MA*, Wells RJD, Quigg A, Hill RL, Appeldoorn RS, Ferreira BD, Boswell KM, Sanchez PJ*, Moulton DL*, Kitchens LL*, Rooker GJ**, Aschenbrenner A* (2018) Seascape connectivity and the influence of predation risk on the movement of fishes inhabiting a back-reef ecosystem. Ecosphere 9(4): e02200. doi:10.1002/ecs2.2200
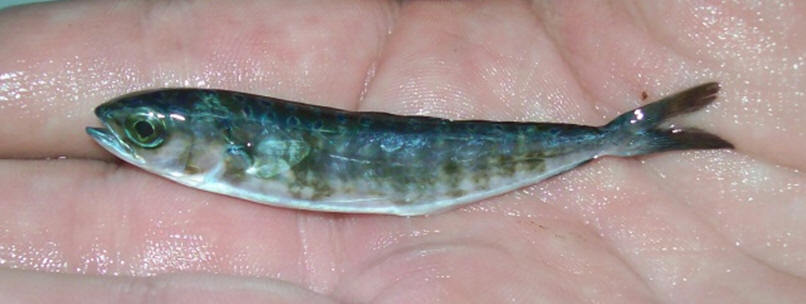
Early life ecology of dolphinfishes in the northern Gulf of Mexico
Dolphinfishes support commercial and recreational fisheries throughout their global range, however, our understanding of their ecology and habitat use during early life is limited. The aim of this study is to evaluate the role of the northern Gulf of Mexico (nGOM) as essential habitat of dolphinfishes and to identify conditions that characterize productive nursery areas for these species. Larvae were collected using neuston nets during summer ichthyoplankton surveys in the nGOM from 2007-2010. Generalized Additive Models (GAMs) were used to assess spatial and temporal variations in abundance across the Loop Current and its associated eddy systems, and nutritional condition, reflecting food availability, will be analyzed through RNA:DNA ratios. Results show that larvae of both species were abundant and broadly distributed across our sampling area, suggesting that this region may be important spawning or nursery habitat of these species. Additionally, models indicate that that the abundance of common dolphinfish is influenced by oceanographic conditions related to mesoscale features in the Gulf.
Funding: McDaniel Charitable Foundation, LSU, LDWF
Associated Publications
Kitchens LL, Rooker JR (2014) Habitat associations of dolphinfish in the Gulf of Mexico. Fisheries Oceanography 23(6): 460-471. doi:10.1111/fog.12081
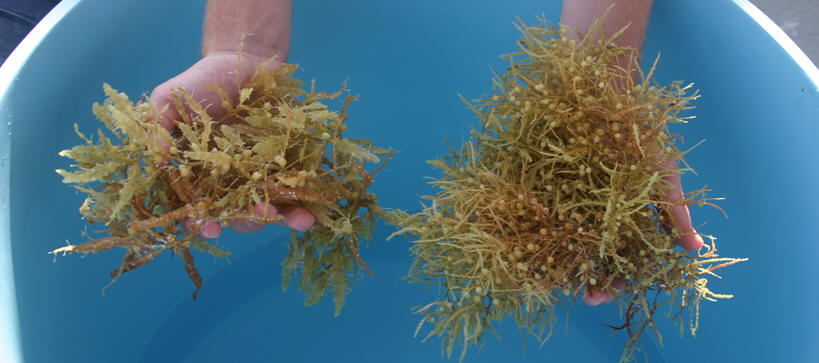
Ecology of fishes associated with Sargassum
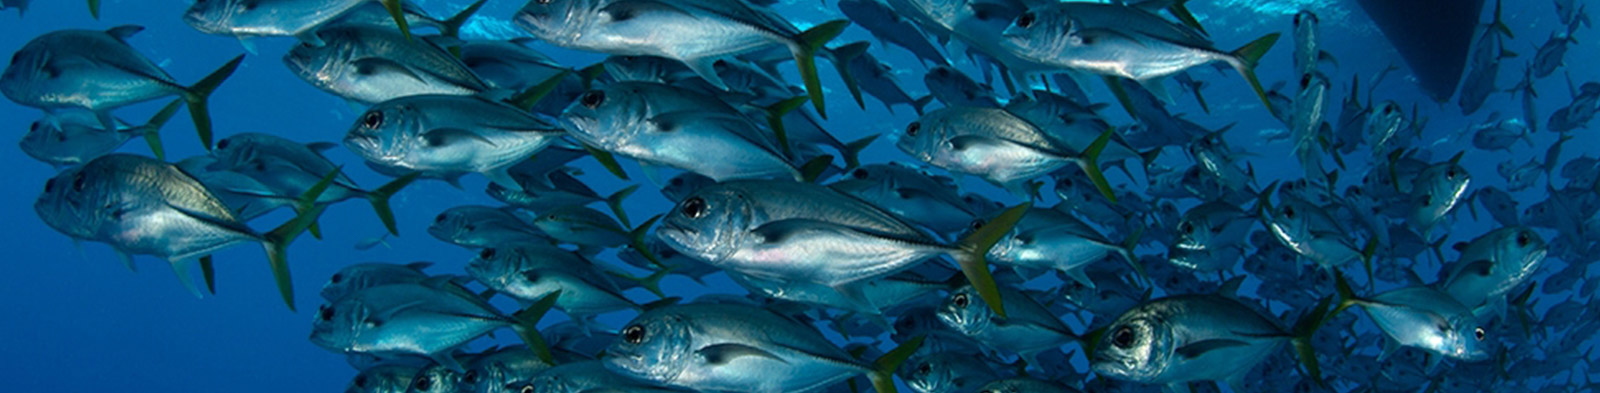
Relatively little information exists on the structure and dynamics of pelagic ecosystems, despite the fact that these systems contribute substantially to total primary production, biogeochemical cycling, and global fishery yields. Sargassum (brown floating algae) is the primary structural habitat feature for juvenile invertebrates and fishes in surface waters of the Atlantic Ocean and Gulf of Mexico, however the ecological function of these habitats is poorly understood. We are using several complimentary approaches to better understand trophic and community structure as well as population dynamics of Sargassum associated fishes. Surveys of Sargassum communities are conducted using larval purse seines to determine species composition as well as juvenile distribution and abundance of important fishery species (e.g. greater amberjack). Otolith based aging techniques are then used to examine relationships of age and growth of Sargassum-associated finfish. To assess food web structure, we are using stable isotopes and fatty acids as natural biomarkers to determine source(s) of organic matter and trophic relationships of associated consumers. These markers are then used to trace pathways of energy flow through the food web from autotrophs to apex predators providing valuable information on the trophic structure of pelagic shelf ecosystems.
Associated Publications
Turner JP, Rooker JR (2006) Fatty acid composition of flora and fauna associated with Sargassum mats in the Gulf of Mexico. Marine Biology 149(5): 1025-1036. doi:10.1007/s00227-006-0269-5
Rooker JR, Turner JP, Holt SA (2006) Trophic ecology of Sargassum-associated fishes in the Gulf of Mexico determined from stable isotope and fatty acid analysis. Marine Ecology Progress Series 313: 249-259. doi:10.3354/meps313249
Wells RJD, Rooker JR (2004) Distribution, age, and growth of young-of-the year greater amberjack, Seriola dumerili, associated with pelagic Sargassum. Fishery Bulletin 102: 545-554.
Wells RJD, Rooker JR (2004) Spatial and temporal habitat use by fishes associated with Sargassum mats in the NW Gulf of Mexico. Bulletin of Marine Science 74(1): 81-99.
Early-life ecology of snapper
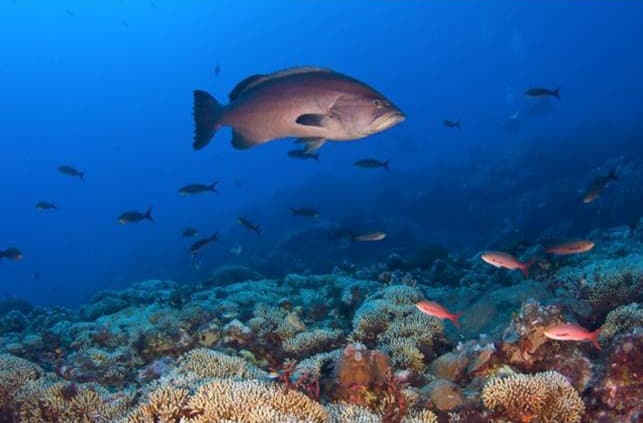
Snapper support large recreational and commercial fisheries in the Gulf of Mexico of considerable economic value. Recent stock assessments have estimated red snapper to be overfished, and thus the ability to identify potentially important nursery habitats during vulnerable juvenile stages is vital to recovering the stock and improving management strategies. The aims of this study are to determine patterns of habitat use by newly settled individuals and assess the quality of different natural banks and habitats used during early life. Digital side-scan sonar and multi-beam bathymetric data are used to define habitat type (mud, shell) and vertical relief at several different banks on the inner-continental shelf of Texas. Otolith based aging is used to determine age at settlement as well as hatch date. Results from this study indicate that both shell and mud habitats associated with inner-shelf banks serve as settlement habitat of red snapper and have the potential to serve as nursery habitat of this species.
Funding: NOAA MARFIN
Associated Publications
Dance MA, Rooker JR (2019) Cross-shelf habitat shifts by red snapper (Lutjanus campechanus) in the Gulf of Mexico. PLoS ONE 14(3): e0213506. doi:10.1371/journal.pone.0213506
Distribution of red snapper on the inner shelf in the northwestern Gulf of Mexico
Red snapper (Lutjanus campechanus) support a fishery of considerable economic and cultural importance in the Gulf of Mexico. The species experienced overfishing in the past and is currently recovering under a stock rebuilding plan; however, the restrictions implemented under the rebuilding plan have caused friction between regulators and stakeholders. To address this, a Gulf-wide project (“The Great Red Snapper Count”, www.harteresearchinstitute.org/snappercount) was developed to generate an estimate of the size of the Gulf of Mexico red snapper population. Our lab is tasked with determining the distribution of red snapper on unconsolidated bottom habitats of the Texas inner continental shelf. These habitats compose the vast majority of the available benthic habitat in the Gulf, and even a low level of use by red snapper may have significant implications for their overall population in the region. An integrated survey method is used to quantify red snapper abundance on unconsolidated habitats, combining biomass estimates from acoustic surveys with species composition information derived from video data. The results of this study will provide key insights into the habitat ecology of this important species.Habitat use and movement of Tarpon along the Texas coast
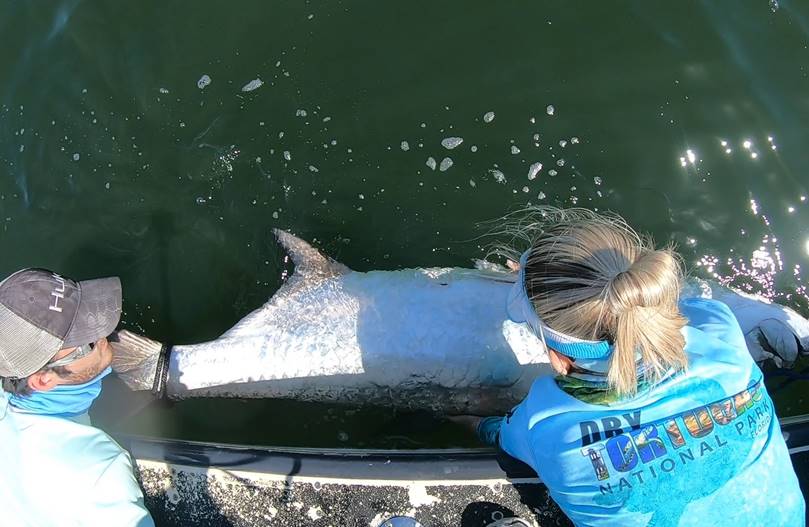
Evidence of the origin and migration pathways of adult tarpon that frequent the Texas coast each year is limited. Scientists assume that two primary spawning grounds exist for tarpon in the Gulf of Mexico (Gulf), with one stock spawning in the SE Gulf around the Florida coast and the other in the SW Gulf from Veracruz to the Bay of Campeche. Genetic evidence indicates that most of the population present in Texas originates from Mexico; however, genetic differentiation has been detected between tarpon collected in north and south Texas, possibly suggesting the presence of two migratory populations. While strict catch regulations have been implemented in U.S. waters, tarpon are regularly harvested in Mexico, and therefore movement of tarpon across the Texas-Mexico border will likely reduce the effectiveness of management strategies aimed at restoring population(s) in the U.S. The primary objective of the Texas Tarpon Tagging Initiative is to track the movements of tarpon in Texas waters using acoustic and satellite telemetry.
Associated Publications
Stephens SA, Dance MA, Kline RJ, Zapp Sluis M, Stunz GW, Adams AA, Wells RJD, Rooker JR (2024) Spatial distribution and movement of Atlantic tarpon (Megalops atlanticus) in the northern Gulf of Mexico. PLoS ONE 19(3): e0298394. doi.org/10.1371/journal.pone.0298394