Imaging FlowCytobot
Imaging FlowCytobot
Galveston Bay is an economically important Texas estuary. It is a major tourist destination, providing >50% and >30% of the state’s recreational and commercial fishing, respectfully. The bay houses the second most productive oyster fishery in the United States and is one of the most successful seafood landing sites in the state, generating upwards of $1 billion in revenue per year. Due to a history of harmful algal blooms which have shut down the oyster hatcheries for weeks or longer at a time, it is important to monitor Galveston Bay. Continuous monitoring of the phytoplankton community in the bay will help keep these fisheries safe and protect humans from ingesting contaminated shellfish and finfish. We work with various state agencies to report on blooms as they occur or to help with sampling. Pertinent information is reported at: https://tpwd.texas.gov/landwater/water/environconcerns/hab/redtide/status.phtml
Since 2008, we have been collecting samples throughout the bay and cataloging the community present using traditional microscopic approaches. Those species most frequently observed have been posted at: https://www.tamug.edu/phytoplankton/projects/Galveston-Bay-Phytoplankton.html.
Some but not all of these are known to cause harmful algal blooms. Our newly acquired Imaging FlowCytobot that was delivered in November 2014 will be used to provide, in near real time, early detection of harmful algal blooms at the entrance to Galveston Bay, giving state officials more time to protect fisheries and consumers. The instrument was purchased with a State Wildlife Grant with the support and assistance of the local Texas Parks and Wildlife Office Coastal Fisheries Division. Starting in June 2017, we started working with the Galveston Bay Estuary Program (Texas Commission on Environmental Quality) to monitor the presence of harmful algal blooms at the mouth of Galveston Bay. Daily samples are being collected at the Texas A&M University, Galveston campus with the specific intent of reporting on HABs. We will work especially with various state agencies (TPWD, TCEQ, GBEP and others) to report on blooms. We will also report to the Texas Department of State Health Services, particularly if there is a concern for human health. In order to raise awareness on a national level, we will also report to the Center for Disease Control’s (CDC) One Health Harmful Algal Bloom System (OHHABS) https://www.cdc.gov/ohhabs/about/. This system collects environmental and illness data related to harmful algal blooms. In addition, we are working with Dr. Heidi Sosik at Woods Hole Oceanographic Institution (WHOI) to prepare the instrument for deployment in the near future. To report a blue-green algae bloom in your area, download the CyanoTRACKER app for both android and iOS phones or at www.cyanotracker.uga.edu. This app was developed at the University of Georgia and allows you to take pictures of and report blooms in your neighborhood.
To view samples taken from the TAMUG daily sampling station on our dashboard, click the image below:
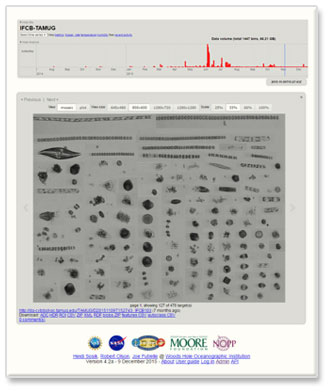
Imaging flow cytometry works by taking individual pictures of microplankton (10 to 150 um). The images are then classified down to the species level. These images are being used to build a library that will automatically identify samples in the future. Currently, the Imaging FlowCytobot is in desktop mode as we build the automated classifier. Each day, we collect a sample from the dock located on campus, which is near the entrance to Galveston Bay. The sample is processed through the cytometer. We then identify each image as well as measure the individual abundance for each species. This helps us determine if a bloom may be occurring.
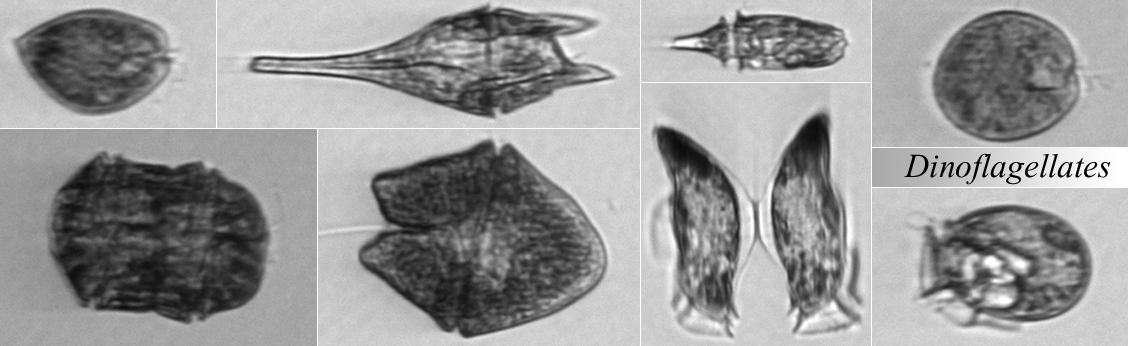
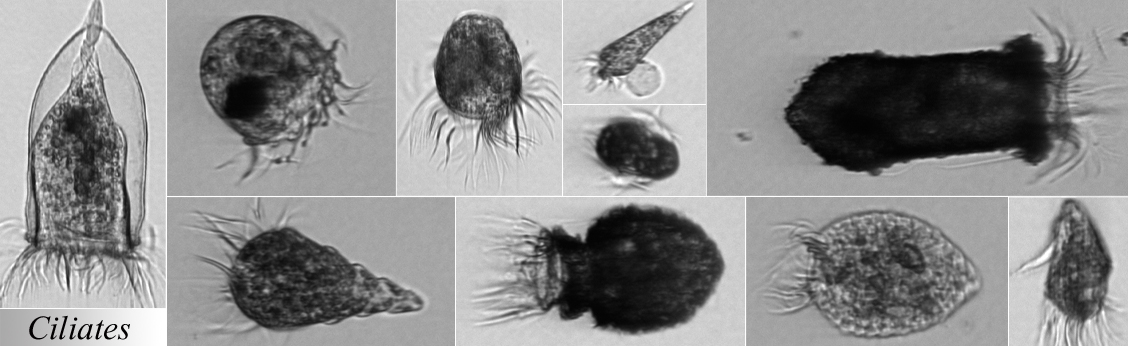
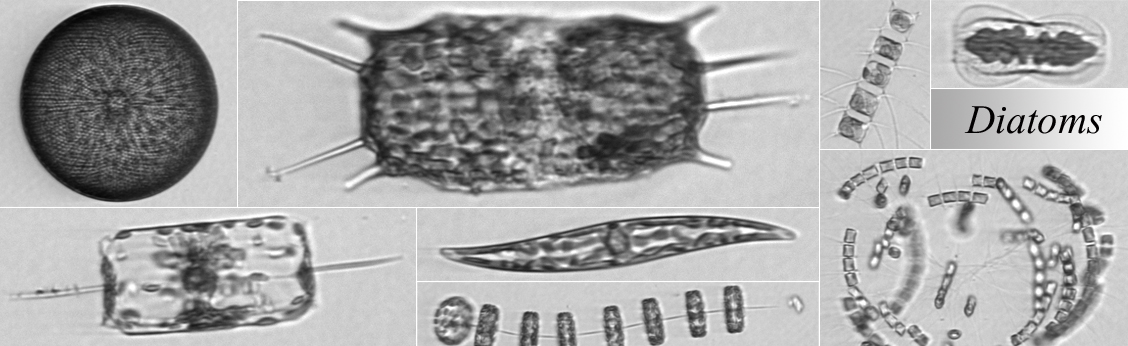
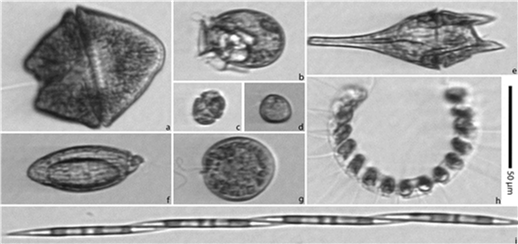
As of August 2015, there are 86 established categories. Each of these categories is equivalent to a species or genus (group of similar species). Diatoms make up the bulk of the species with 51 different classification groups. Dinoflagellates are a distant second with 16 groupings, and the rest of the categories are divided into cyanobacteria, microzooplankton, coccolithophores, haptophytes, Chlorophyceae, Euglenophyceae, Dictyochophyceae and Pyramimonadales. Some of our favorites are shown below:
While the Imaging FlowCytobot is stationed in the lab, multiple side experiments are also underway. Monthly samples from stations spanning the bay are being taken in order to assess the spatial effects of freshwater inflows on phytoplankton community structure. The daily samples are being used to assess the effects of disturbance on phytoplankton diversity at our daily sampling station.
![]()

![]()
![]()
![]()
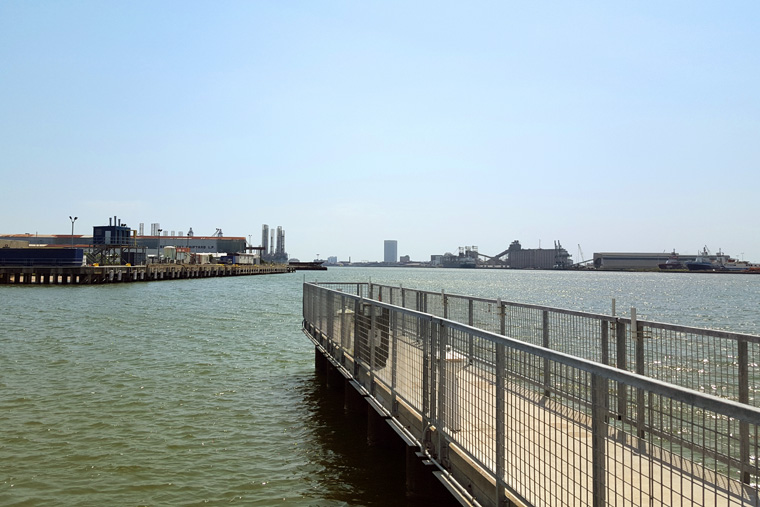
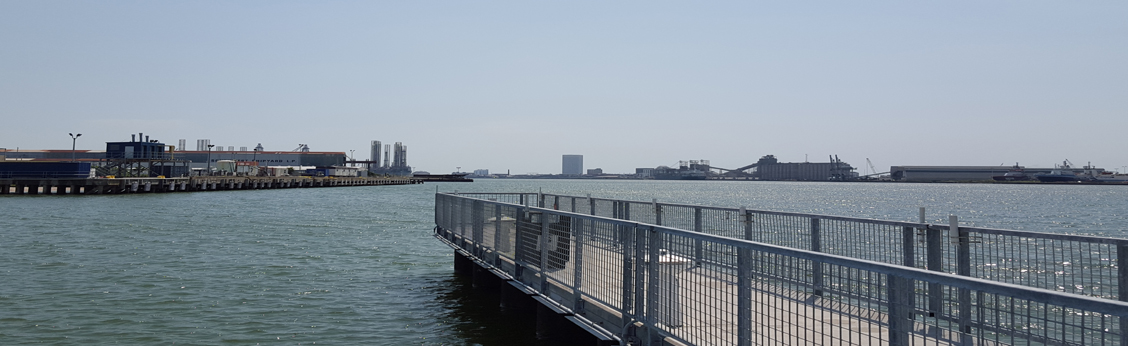
View from the daily sampling location on campus. The pier sits near the entrance to Galveston Bay.
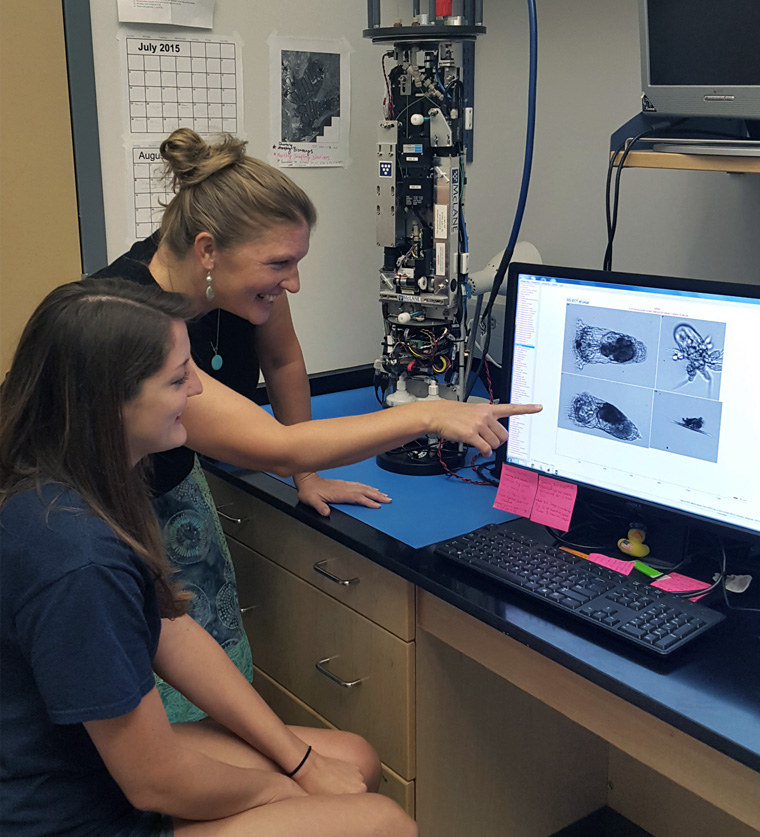
Dr. Jamie Steichen and Jennifer Genzer working on identifying samples for the automated classifier's library.

Hannah Preischel with her first IFCB poster that she presented during a workshop at WHOI.
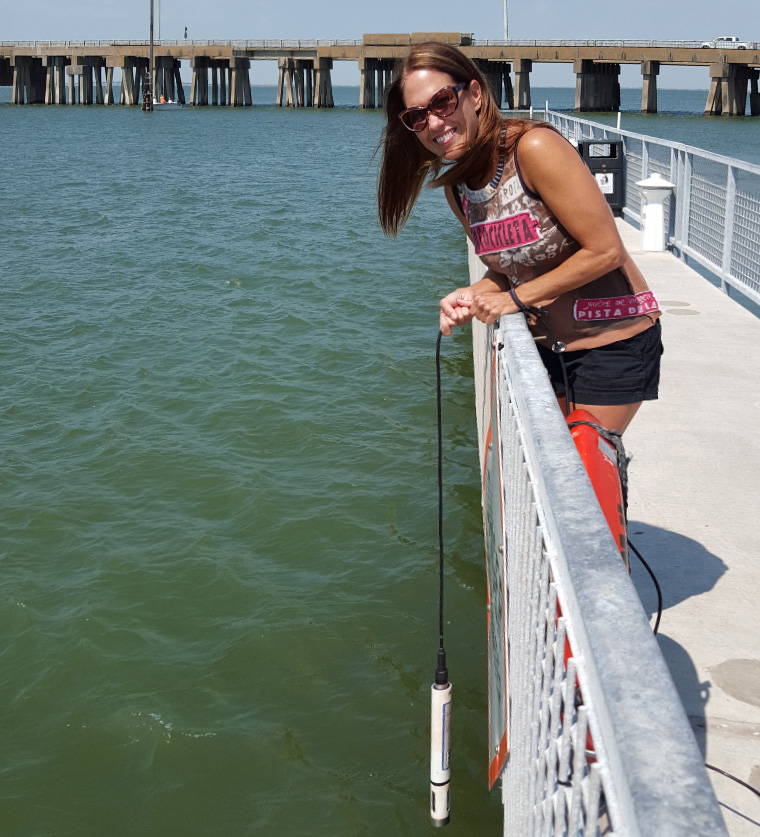
Shiron Lawrence sampling physical characteristics of the water using a Hydrolab. This data is used to accompany the IFCB's daily sample.
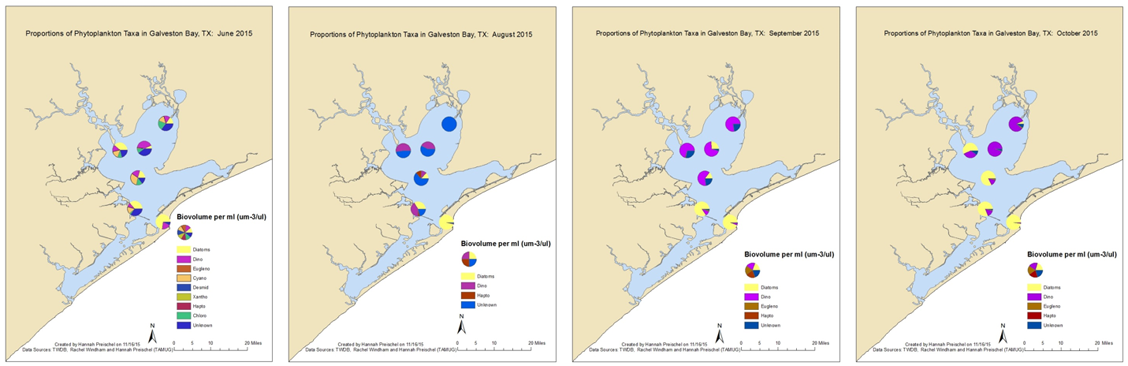
Phytoplankton taxa present in Galveston Bay: June-October 2015. A flooding event in May and June introduced additional taxa to the system.